Your money buys cars at auction. We make them rentable and put them with gig drivers
who need a vehicle to earn. You take a fixed cut of what each car actually brings in, every month.
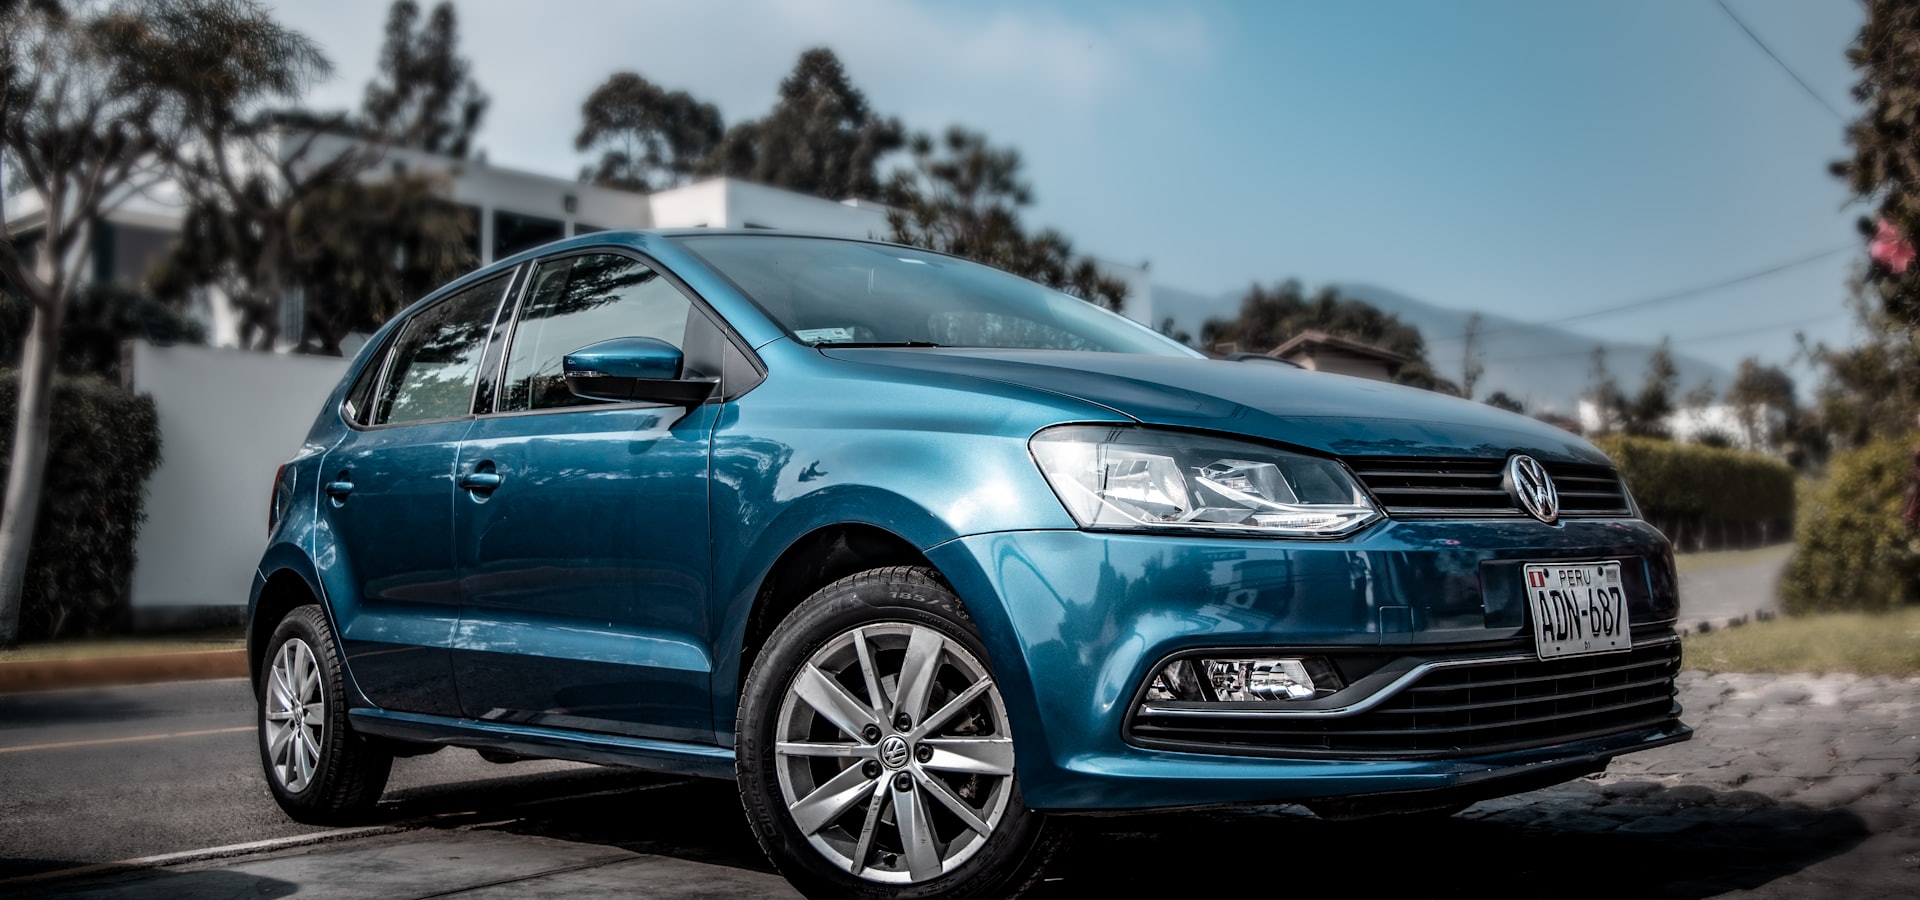
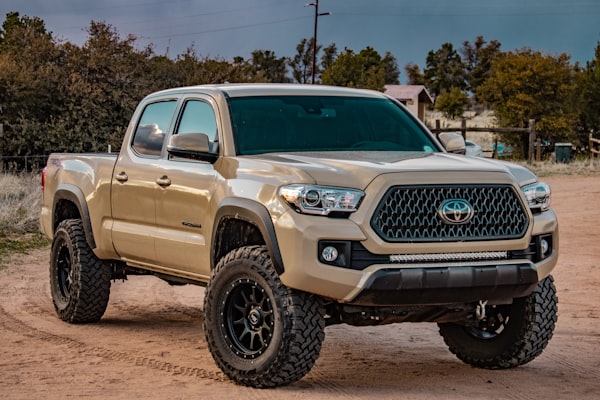
The class of vehicle the fleet buys — cheap to insure, cheap to fix, easy to place.
Founding · $10,000 · 2 vehicles · 38% of net revenue
$702.37
every month, for 24 months
1.69×
your money back, plus 69%
$16,857
total received
$6,857
of that, profit
Month 20
your $10,000 is back
49%
IRR — comparison only
Projections, not guarantees. Every figure is calculated
from the assumptions shown. Actual results will vary. Past performance does not indicate future results.
Your capital is at risk and you may receive back less than you invest.
The one line that matters
Your money comes back through the payments
“Distributions constitute both return of capital and profit. No separate
repayment of principal is owed.”
Every total on this page is all the money that reaches you. There is no
second cheque at the end. When a tier shows a total, that figure is your buy-in coming back plus your
profit — counted once. The contract says it in these exact words.
Where the conservatism lives
We cut the rate first, then run the numbers
Rather than quote a market rate and argue about how often a car sits, we take the discount at the top
and every figure runs from there.
$16,640 modelled
0% held back0%
$0$16,640 — market, per vehicle, per year
Market for this vehicle class is about $320.00 a week, or $16,640 a vehicle a year. You are at $320 — 0% held back up front for downtime, market shifts and unforeseen loss. Every figure on this page already carries that discount.
What your money buys
The kind of car that earns
Nothing exotic. Clean, cheap to insure, cheap to fix, and the sort of vehicle a gig driver is
willing to work in every day — which is what keeps it rented.
SedanSUVTruck
One vehicle
Where every dollar goes
Each tier is this same picture, multiplied by the number of vehicles your buy-in purchases.
Show the per-vehicle breakdown
One vehicle, end to end
Every tier is this picture multiplied by the number of vehicles
Your shareOperator / grossCost
Every bar below covers the same 28 earning months, drawn to the same scale:
Rental collected$320/wk × 52 weeks = $16,640 a year
$38,827
Less maintenance$750 a year
$1,750
Net revenuewhat gets divided
$25,877
Of that net, the operator keeps the build period and the rest is shared:
Build periodfirst 4 months, operator keeps all
$3,697
Sharing poolthe next 24 months
$22,180
Your share of one vehicle$8,428.40× 2 vehicles = $16,857
A vehicle costs $5,000 at auction, which is why buy-ins come in $5,000 steps — none of your money sits idle. Maintenance is the only recurring cost in this model.
The timeline
When the money arrives
Month 1 is onboarding — inspection, repair, chipping, platforming. Months
2–5 the vehicle earns and we keep all of it to
pay for getting it on the road. From month 6 you are paid every month for
24 months.
Money in your hand, month by month
Shaded area is the Founding tier · dashed line is what you put in
FoundingPartnerPrincipal
Nothing for the first 5 months while the vehicles are bought, made ready and placed. From month 6 you are paid every month. Where the line crosses the dashed line you have your $10,000 back — everything above it is profit.
Money in your hand, month by month
Shaded area is the Founding tier · dashed line is what you put in
FoundingPartnerPrincipal
Nothing for the first 5 months while the vehicles are bought, made ready and placed. From month 6 you are paid every month. Where the line crosses the dashed line you have your $10,000 back — everything above it is profit.
Side by side
What the three tiers return
Show all three tiers side by side
All three tiers side by side
Grey is your own money coming back · colour is profit
Your buy-in, returnedFounding profitPartner profitPrincipal profit
Founding$10,000 · 2 vehicles
$16,8571.69×
Partner$15,000 · 3 vehicles
$26,6161.77×
Principal$20,000 · 4 vehicles
$37,2621.86×
The multiple is total divided by buy-in, and it rises with the tier because the revenue share does: 38% at $10,000, 40% at $15,000, 42% at $20,000.
The risk
What if the cars sit longer than we allowed for
This is the assumption that decides everything, so it gets a chart rather than a footnote.
$320
52 weeks
$400
No quote has been obtained. This is the largest unknown in the model
and it is the reason this control exists. Renting vehicles to drivers is a
rental fleet risk, which runs $300–1,500 per vehicle per month — not ordinary
commercial auto at $90–350, which excludes vehicles entrusted to others and would not cover
this business at all. Cost varies by state, and OTAG operates in three: Michigan, Georgia and
California. Each needs its own quote.
The business underneath — every one of these moves the answer
Your own position — this is the one to move if you reinvest
Buy-in is cars × what a car costs, so no part of your money ever
sits waiting for a fraction of a vehicle. Add a car and watch the whole picture move — that is
what reinvesting looks like before you do it.
4 months
The vehicles are earning through these months and the operator keeps all of it,
to get the fleet on the road. Your total is unchanged — it just starts later.
24 months
The monthly cheque does not shrink when this is shortened — you
simply receive fewer of them. Cut it far enough and the payments stop before your capital is back.
It stops at 44 because a $5,000
car is not assumed to earn past 48 months on the road.
The first two multiply into one number — what a vehicle earns in a year. The
second two set the window: how long before you are paid, and for how many months. None of these four
is a quoted price or a promised term. They are here so you can see how the return responds before you
put money in, and so the per-vehicle figures in your portal mean something when you open it.
$16,640 modelled
0% held back0%
$0$16,640 — market, per vehicle, per year
Market for this vehicle class is about $320.00 a week, or $16,640 a vehicle a year. You are at $320 — 0% held back up front for downtime, market shifts and unforeseen loss. Every figure on this page already carries that discount.
What if the cars sit more than expected
The Founding tier highlighted · set at the measured market rate
FoundingPartnerPrincipal
This chart asks what happens if occupancy is worse than assumed. Founding stops making money below 38 rented weeks — 73% of the year. Because your payment is a share of what the vehicle actually earns rather than a fixed amount, a slow month is a smaller payment, not a missed one.
What if the cars sit more than expected
The Founding tier highlighted · set at the measured market rate
FoundingPartnerPrincipal
This chart asks what happens if occupancy is worse than assumed. Founding stops making money below 38 rented weeks — 73% of the year. Because your payment is a share of what the vehicle actually earns rather than a fixed amount, a slow month is a smaller payment, not a missed one.
Projections, not guarantees. Every figure is calculated
from the assumptions shown. Actual results will vary. Past performance does not indicate future results.
Your capital is at risk and you may receive back less than you invest.
Every payment
The full 29 months
Show every payment, month by month
Grey bar on the left means the payment is still returning your buy-in. Coloured bar means
you are past it and the rest is profit.
Mo
Phase
Payment
Received to date
Still to come
1
Onboarding
—
$0
$16,857
2
Build period
—
$0
$16,857
3
Build period
—
$0
$16,857
4
Build period
—
$0
$16,857
5
Build period
—
$0
$16,857
6
first payment
$702.37
$702
$16,154
7
Distribution
$702.37
$1,405
$15,452
8
Distribution
$702.37
$2,107
$14,750
9
Distribution
$702.37
$2,809
$14,047
10
Distribution
$702.37
$3,512
$13,345
11
Distribution
$702.37
$4,214
$12,643
12
Distribution
$702.37
$4,917
$11,940
13
Distribution
$702.37
$5,619
$11,238
14
Distribution
$702.37
$6,321
$10,536
15
Distribution
$702.37
$7,024
$9,833
16
Distribution
$702.37
$7,726
$9,131
17
Distribution
$702.37
$8,428
$8,428
18
Distribution
$702.37
$9,131
$7,726
19
Distribution
$702.37
$9,833
$7,024
20
paid back in full
$702.37
$10,536
$6,321
21
Distribution
$702.37
$11,238
$5,619
22
Distribution
$702.37
$11,940
$4,917
23
Distribution
$702.37
$12,643
$4,214
24
Distribution
$702.37
$13,345
$3,512
25
Distribution
$702.37
$14,047
$2,809
26
Distribution
$702.37
$14,750
$2,107
27
Distribution
$702.37
$15,452
$1,405
28
Distribution
$702.37
$16,154
$702
29
Distribution
$702.37
$16,857
$0
Resources & sources
Where these numbers come from
Everything on this page rests on one figure: what a gig driver pays to rent a car. So here is
what our actual competitors charge, in our actual markets, with a link to every page we read it off.
Show the rate survey, the sources and the closures
What competitors charge, per week
Every operator publishing a rate in our three markets · retrieved 31 July 2026
Gold is Atlanta, plum is Michigan, grey is the Bay Area. Bars showing a range span the
operator’s published low and high. Where a rate excludes insurance or tax it is marked on the bar
— a $308 rate without insurance is not the same product as a $350 rate with it.
Average rate by market
Blue is what we model · the rest is how far under the local average that sits
Atlanta / Marietta5 operators publishing rates
$308avg
Detroit / Ann Arbor2 operators publishing rates
$350avg
Bay Area / Alameda2 operators publishing rates
$224avg
What we model, $320The rest of the local average
Atlanta — Deepest market of the three. Five operators publishing rates, and the master mechanic is on the ground here. Michigan — Highest rates of the three and the thinnest competition — both operators sit in Detroit metro, neither in Ann Arbor itself. Bay Area — No independent operator publishes a rate here. The market is held by the national platform programmes, which price nationally — so the most expensive place to operate has the cheapest achievable rent.
Where our $320 sits.
Across the 7 independent operators in Atlanta and Michigan — the
businesses that most resemble ours — the average is $320 a
week. We model $320, which is
0% below it, and
4 of the 7 charge more than we assume.
We deliberately exclude Lyft Express Drive and Hertz from that average. They run their
own fleets at national scale and price to funnel drivers into their platforms — comparing a
small operator to them flatters nobody and tells you nothing.
Two things keep this honest: their cars are newer than ours, so part
of that gap is a worse vehicle rather than a better deal; and most of them bundle
insurance, which we do not.
Why a $5,000 car still earns
Passenger rideshare imposes vehicle age caps and only accepts rentals through approved
partner programmes. Delivery does neither — which is why an older, cheaper car is the right
vehicle for this business rather than a compromise.
✓Amazon FlexAny age4-door required. A few stations quietly apply a 10–15 year cap.
✓DoorDashAny ageRentals accepted with insurance documentation.
✓Uber EatsAny ageRentals accepted with insurance documentation.
✓InstacartAny ageRentals accepted with insurance documentation.
!Uber (riders)8–19 yrsVaries by market. Rented vehicles restricted to approved partner programmes.
!Lyft (riders)8–19 yrsVaries by market. Rented vehicles restricted to approved partner programmes.
How the driver’s insurance works
Rideshare cover is split into three periods, and only the first is a real gap. Some
carriers now bill it by the day the driver is actually working.
Period 1
App on, no request yet
The gap
Personal policies typically exclude it and the platform provides little or no collision cover. This is the gap a rideshare endorsement fills.
Period 2
Request accepted, en route
Uber / Lyft
The platform carries primary cover from acceptance until pickup.
Period 3
Passenger or order aboard
Uber / Lyft
Platform cover continues through to drop-off.
Billed by the day, not the month.
Mercury charges about $0.90 a day — roughly $27 a month for someone driving daily, and less for anyone who does not. It is the only carrier found offering usage-based billing, and it covers the Period 1 gap.
Available in 9 states, including California, Arizona, Nevada, Florida, Oklahoma, Georgia, Texas, Illinois, Virginia. Not Michigan.
California driver cost
Per month
Rideshare endorsement added to a personal policy
$17
Full standalone rideshare cover
$113–$205
Operators that have left this market
Worth knowing, because it is the honest counterweight to everything above.
HyreCarCeased operations. The peer-to-peer marketplace that let independent owners rent to gig drivers — the closest match to this model.
GIG Car ShareNo longer offers a vehicle rental product.
Rideshare RentalNo longer offers a vehicle rental product.
What this means for us. HyreCar was the
marketplace that made independent ownership work at scale. Its closure means placing a vehicle is a
direct-sales job — local advertising and driver relationships — not a listing on someone
else’s platform. That is an operating cost and a real risk, and it is not modelled anywhere on
this page.
Retrieved 31 July 2026. Published rates move; check them again before reusing these figures.
After the term
There is a second round
Show how a second round works
Investors who complete a term are invited to run it again — at the same tier, or a higher one.
Stepping up is encouraged, and the first round is deliberately sized so that it can fund the next.
Second-round terms are agreed at the time and are not part of this offering. Nothing on
this page assumes or depends on a second round.
No hidden inputs
Every assumption, stated
Nothing on this page is typed in by hand. These are the only inputs; every other number is
calculated from them.
Show every input behind these figures
Break-even is $776 per vehicle per month.
At the $320/week and 24 payments set above, the Founding investor stops getting their capital back once insurance passes $776. Insurance is currently set to $400.
To return 1.5× at $400/month insurance you would need to charge $297 a week, which is inside the $320 measured market.
These are illustrations, not promises. Every figure here shows what the vehicles would return at the lease level set below. What you actually earn is what your actual cars actually rent for, month by month — which you will see per vehicle in your investor portal. Move the controls to understand how value and performance respond; no position on these scales is a quoted price or a guaranteed return.
Vehicle cost
$5,000
Market rate
$320/wk
Held back
0%
Rate modelled
$320/wk
Weeks rented
52 of 52
Maintenance
$750/yr
Insurance
$400/mo
Onboarding
1 mo
Build period
4 mo
You are paid
24 mo
Full term
29 mo
Buy-ins come in $5,000 steps because that is what a vehicle costs —
no part of your money sits idle waiting for a fraction of a car. Maintenance is the only recurring cost
in this model. Vehicle title, residual value at term end, and any reserve for replacement are addressed
in the investment agreement, not here.
Projections, not guarantees. Every figure is calculated
from the assumptions shown. Actual results will vary. Past performance does not indicate future results.
Your capital is at risk and you may receive back less than you invest.
Ask about the termsAnswering for the Founding tier
Answers are calculated live from the same model as the page. No figure here is
typed in, and nothing is invented — if it does not know, it says so.